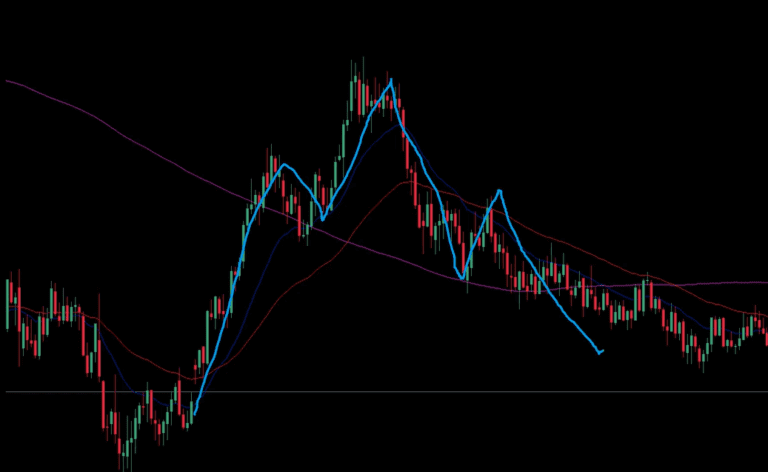
How to Do Technical Analysis for Beginners

Today, we’ll take a detailed, beginner-friendly look at technical analysis and provide practical strategies to implement what you learn. This guide is designed to help you build a strong foundation in technical analysis and start trading with confidence.
Introduction
Technical analysis is the study of historical price movements to predict future price behavior. It’s a crucial skill for traders who want to make informed decisions based on market data. Let’s dive into the steps and strategies that will set you on the path to success.
Step 1: Understanding Charts
Types of Charts
- Line Charts: Simple charts that plot the closing prices over a period.
- Bar Charts: Show opening, high, low, and closing prices for each period.
- Candlestick Charts: Similar to bar charts but more visual, displaying the same price points with different colored candles.
Practical Application
- Candlestick Patterns: Learn common patterns like Doji, Hammer, and Engulfing patterns. For example, a Hammer at the bottom of a downtrend often indicates a potential reversal. Practice recognizing these patterns on historical charts.
Step 2: Identifying Trends
Types of Trends
- Uptrend: Higher highs and higher lows.
- Downtrend: Lower highs and lower lows.
- Sideways Trend: Prices move horizontally within a range.
Drawing Trendlines
- How to Draw: Connect two or more lows in an uptrend and two or more highs in a downtrend. Use these lines to identify potential support and resistance levels.
Practical Application
- Entry and Exit Points: In an uptrend, buy near the trendline (support) and sell at new highs (resistance). In a downtrend, sell near the trendline (resistance) and buy at new lows (support).
Step 3: Understanding Support and Resistance
Definitions
- Support: A price level where a downtrend can pause due to buying interest.
- Resistance: A price level where an uptrend can pause due to selling interest.
Practical Application
- Bounce Strategy: Buy when the price bounces off support and sell when it hits resistance. Confirm bounces with candlestick patterns or indicators like RSI.
Step 4: Using Technical Indicators
Moving Averages
- Simple Moving Average (SMA): Average price over a specific period. Common periods are 50, 100, and 200 days.
- Exponential Moving Average (EMA): Gives more weight to recent prices, making it more responsive to new information.
Relative Strength Index (RSI)
- RSI: Measures the speed and change of price movements. Values above 70 indicate overbought conditions, and below 30 indicate oversold conditions.
Moving Average Convergence Divergence (MACD)
- MACD: Shows the relationship between two moving averages. The MACD line crossing above the signal line suggests a buy, while crossing below suggests a sell.
Practical Application
- Combining Indicators: Use multiple indicators to confirm signals. For instance, combine SMA with RSI to confirm trend strength and potential reversal points.
Step 5: Chart Patterns
Common Patterns
- Head and Shoulders: Indicates a reversal.
- Double Tops and Bottoms: Indicates a potential reversal.
- Triangles: Indicate a continuation of the trend.
Practical Application
- Breakout Strategy: Trade when the price breaks out of the pattern. For example, in a triangle pattern, enter a trade when the price moves beyond the pattern’s boundaries.
Step 6: Practice and Application
Backtesting
- Backtesting: Test your strategies on historical data. This helps you understand how your strategy would have performed in the past.
Demo Trading
- Demo Accounts: Practice with a demo account to gain confidence without risking real money. This is crucial for honing your skills before transitioning to live trading.
Conclusion
Mastering technical analysis is a journey that involves continuous learning and practice. By understanding charts, identifying trends, recognizing support and resistance levels, using technical indicators, and familiarizing yourself with common chart patterns, you can make informed trading decisions.
Call to Action
Ready to take your trading skills to the next level? Talk to a Trader today for personalized guidance and strategies: Click here to chat.
We are excited to offer you an opportunity to learn how to trade Forex with Financial Markets Online. To get started, simply send the following message to our WhatsApp number:
“Hey, Thanks for your email. I am interested in learning how to trade Forex and working with Financial Markets Online.”
WhatsApp Contact: Click here to chat
Looking forward to helping you on your trading journey!
Educational Takeaways:
- Understanding Charts: Learn about different types of charts and how to read them.
- Identifying Trends: Recognize uptrends, downtrends, and sideways trends.
- Support and Resistance: Identify key price levels for buying and selling.
- Technical Indicators: Use indicators like SMA, EMA, RSI, and MACD for better analysis.
- Chart Patterns: Familiarize yourself with patterns that indicate market movements.
- Practice and Application: Backtest your strategies and practice with a demo account.
Join our community and start your journey to trading success today!
Join our upcoming webinar for an in-depth discussion on day trading strategies and other advanced topics. Register here: Talk to a Trader.
Happy Trading!


