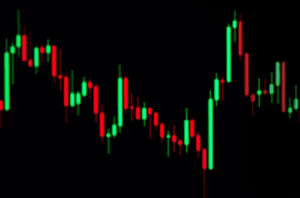
Introduction to Japanese Candlesticks: Navigating Trend Lines and Channels in Forex Trading

Today, we delve into the intricacies of trend lines and channels, fundamental tools that provide structure to market analysis in Forex trading. By understanding and applying these concepts effectively, you can enhance your trading strategy and potentially improve your market outcomes.
Understanding Trend Lines
A trend line is a straight line that connects two or more price points and then extends into the future to act as a line of support or resistance. Here are the basics:
- Uptrend Line: Drawn along the bottom of easily identifiable support areas (valleys). It indicates that the price is increasing.
- Downtrend Line: Drawn along the top of easily identifiable resistance areas (peaks). It suggests that the price is decreasing.
These lines help traders identify the direction of market trends and make predictions about future movements.
What are Channels?
Channels are formed by drawing parallel lines at the same angle as the trend lines that also model the heights of other significant peaks (in an uptrend) or valleys (in a downtrend):
- Ascending Channel: Formed during an uptrend, indicating higher highs and higher lows.
- Descending Channel: Formed during a downtrend, showing lower highs and lower lows.
- Horizontal Channel: Indicates that the market is ranging without a clear trend.
Channels help traders recognize potential buy and sell points within a trend, providing opportunities for strategic entry and exit.
Trading Support and Resistance Levels
Effective trading on support and resistance levels can involve two key strategies:
- The Bounce: Wait for the price to bounce off the level to confirm it holds before entering a trade. This method increases the likelihood that the support or resistance will not be broken.
- The Break: There are aggressive and conservative approaches to trading breaks:
- Aggressive: Trade as soon as the price breaks through a support or resistance zone.
- Conservative: Wait for a pullback to the broken level and enter after the price bounces.
Introduction to Japanese Candlesticks
Candlesticks are a powerful component of technical analysis, offering detailed insights into market sentiment and potential price movements. They are formed using the open, high, low, and close prices of a specific time frame. The body’s length can indicate buying or selling pressure, while the shadows show how high or low the prices have gone.
Key Candlestick Configurations:
- Marubozu: Shows strong buying or selling pressure without shadows.
- Doji: Indicates indecision in the market as the open and close are virtually the same.
- Spinning Tops: Characterized by small bodies and long shadows, denoting a balanced fight between buyers and sellers with no clear winner.
Conclusion
Mastering the art of reading trend lines, channels, and candlestick patterns can significantly enhance your analytical skills and trading decisions in Forex. These tools not only help predict market movements but also provide clear signals for managing trades more effectively.
Are you ready to dive deeper into Forex charting techniques and refine your trading strategies? Join our next webinar where we explore advanced concepts in chart analysis. Register now to secure your spot and elevate your trading to the next level!
Let’s chart a course for success together in the exciting world of Forex trading!


